3. Spatial ATAC–RNA-seq dataset
Integration of homologous Spatial ATAC–RNA-seq slice.
The spatial ATAC-RNA-seq dataset of the E13 mouse embryo comprises 5,328 spots with genome-wide co-profiling of epigenome and transcriptome, enabling simultaneous measurement of approximately 24,017 accessible chromatin regions and 15,748 messenger RNA expression.
As both modalities are derived from the same tissue slice, no alignment is required. Instead, the different omics profiles are represented by separate AnnData objects to facilitate integration.
Preparation
[1]:
import sys
import time
from spatialFuser import *
import scanpy as sc
import pandas as pd
import numpy as np
sys.path.append("..")
/home/whcai/anaconda3/envs/PyG/lib/python3.9/site-packages/louvain/__init__.py:54: UserWarning: pkg_resources is deprecated as an API. See https://setuptools.pypa.io/en/latest/pkg_resources.html. The pkg_resources package is slated for removal as early as 2025-11-30. Refrain from using this package or pin to Setuptools<81.
  from pkg_resources import get_distribution, DistributionNotFound
Hyper-Parameters setting
All hyperparameters are stored in the variable args. To display them during initialization, use the function call args = def_training_args(show_detail=True).
As the spatial ATAC–RNA-seq dataset enables high-throughput profiling of both the transcriptome and the epigenome, SpatialFuser employs two-layer MCGATE models with a high latent dimension to learn data embeddings.
[2]:
# load args:
print("============================================")
print("=              Setting Params              =")
slice_1_args = def_training_args()
slice_1_args.hidden = [512, 32]
slice_1_args.epochs = 500
slice_1_args.lr = 5e-4
slice_1_args.K = 4
slice_1_args.heads = 2
slice_1_args.alpha = 0

slice_2_args = def_training_args()
slice_2_args.hidden = [512, 32]
slice_2_args.epochs = 500
slice_2_args.lr = 1e-3
slice_2_args.K = 4
slice_2_args.heads = 2
slice_2_args.alpha = 0

integration_args = def_training_args()
integration_args.hidden = [32, 32]
integration_args.fusion_epoch = 500
integration_args.lr = 1e-4
integration_args.match_step_size = 20
integration_args.tau = 0.1
integration_args.roi_radius = 0.01
integration_args.epsilon = 1
integration_args.m_top_K = 2
integration_args.beta_rec = 50
integration_args.beta_dir = 0.1
integration_args.verbose = False
============================================
=              Setting Params              =
Load data
SpatialFuser provides a built-in data loading and preprocessing module, SpatialFuserDataLoader. The required inputs include hyperparameters, data_dir (the dataset storage directory), data_tech (either “seq-based” or “image-based”), and files (a list of h5ad files to be loaded).
For spatial omics data, SpatialFuserDataLoader constructs a KNN adjacency graph based on the specified value of K to support graph neural network training.
For seq-based data, spatially variable genes are extracted according to n_svgs to simplify the model.
All AnnData objects are normalized, log-transformed, and subsequently converted into PyG objects for model input.
[3]:
# load data:
print("============================================")
print("=               Loading Data               =")
slice_1_dataLoader = SpatialFuserDataLoader(slice_1_args,
                                            data_dir='/public8/lilab/student/whcai/Integration/data/Spatial-ATAC-RNA-seq_FanRong/MouseE13',
                                            data_tech='seq-based',
                                            files=['ATAC.h5ad'])

slice_1_dataLoader.load_adata()
slice_1_dataLoader.pre_processing(n_svgs=3000, k_cutoff=slice_1_args.K, batch_label=[1])
slice_1_dataLoader.generate_minibatch(loader_type='RandomNodeLoader', num_workers=5)

slice_2_dataLoader = SpatialFuserDataLoader(slice_2_args,
                                            data_dir='/public8/lilab/student/whcai/Integration/data/Spatial-ATAC-RNA-seq_FanRong/MouseE13',
                                            data_tech='seq-based',
                                            files=['RNA.h5ad'])
slice_2_dataLoader.load_adata()
slice_2_dataLoader.pre_processing(n_svgs=3000, k_cutoff=slice_2_args.K, batch_label=[2])
slice_2_dataLoader.generate_minibatch(loader_type='RandomNodeLoader', num_workers=5)

slice_1_dataLoader.adata.obs['Region'] = slice_1_dataLoader.adata.obs['Joint_clusters']
slice_2_dataLoader.adata.obs['Region'] = slice_2_dataLoader.adata.obs['Joint_clusters']
============================================
=               Loading Data               =
/home/whcai/anaconda3/envs/PyG/lib/python3.9/site-packages/scanpy/preprocessing/_highly_variable_genes.py:61: UserWarning: `flavor='seurat_v3'` expects raw count data, but non-integers were found.
  warnings.warn(
=         Calculating spatial graph        =
The PyG data u create is qualified
=The graph contains 10935 edges, 2187 cells=
=   5.0000 neighbors per cell on average   =
=              subgraph Info             =
============================================
=           Batch 0: 2187 nodes           =
=   4.0000 neighbors per cell on average   =
batch:[1.], node num:[2187]
============================================
/home/whcai/anaconda3/envs/PyG/lib/python3.9/site-packages/scanpy/preprocessing/_highly_variable_genes.py:61: UserWarning: `flavor='seurat_v3'` expects raw count data, but non-integers were found.
  warnings.warn(
=         Calculating spatial graph        =
The PyG data u create is qualified
=The graph contains 10935 edges, 2187 cells=
=   5.0000 neighbors per cell on average   =
=              subgraph Info             =
============================================
=           Batch 0: 2187 nodes           =
=   4.0000 neighbors per cell on average   =
batch:[2.], node num:[2187]
============================================
/tmp/ipykernel_17140/2490770323.py:21: ImplicitModificationWarning: Trying to modify attribute `.obs` of view, initializing view as actual.
  slice_1_dataLoader.adata.obs['Region'] = slice_1_dataLoader.adata.obs['Joint_clusters']
/tmp/ipykernel_17140/2490770323.py:22: ImplicitModificationWarning: Trying to modify attribute `.obs` of view, initializing view as actual.
  slice_2_dataLoader.adata.obs['Region'] = slice_2_dataLoader.adata.obs['Joint_clusters']
Train
The MCGATEs are first pre-trained individually, after which the fusion layer and matching layer are incorporated into the training process.
[4]:
# train
print("============================================")
print("=              Begin to Train              =")
training_time = time.time()
[adata1, adata2], trainer = train_integration([slice_1_args, slice_2_args, integration_args],
                                              [slice_1_dataLoader, slice_2_dataLoader])
print("=            Training Finished!            =")
print("Total time elapsed: {:.4f}s".format(time.time() - training_time))
print("============================================")
============================================
=              Begin to Train              =
/public8/lilab/student/whcai/Integration/model/SpatialFuser/spatialFuser/train.py:137: UserWarning: torch.sparse.SparseTensor(indices, values, shape, *, device=) is deprecated.  Please use torch.sparse_coo_tensor(indices, values, shape, dtype=, device=). (Triggered internally at ../torch/csrc/utils/tensor_new.cpp:605.)
  self.adata1_adata2atial_adj = torch.sparse.FloatTensor(batch_in_data1.edge_index,
Epoch 500 || adata1_pretrain_loss: 0.0015 || adata2_pretrain_loss: 0.237 || : 100%|███| 500/500 [00:25<00:00, 19.76it/s]
Epoch 500 || Fusion_loss : 0.1735 || MSE_loss: 0.2457 || Dir_loss: 0.8783 || : 100%|██| 500/500 [00:30<00:00, 16.25it/s]
=            Training Finished!            =
Total time elapsed: 57.2971s
============================================
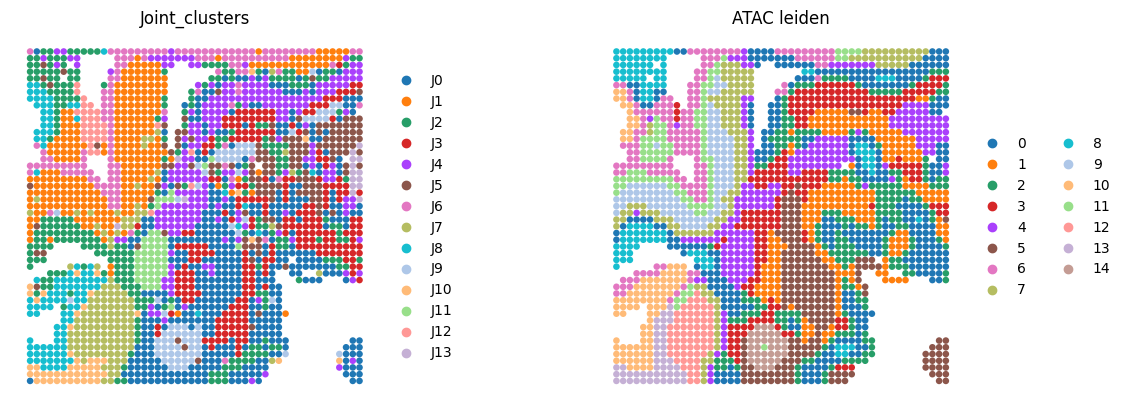
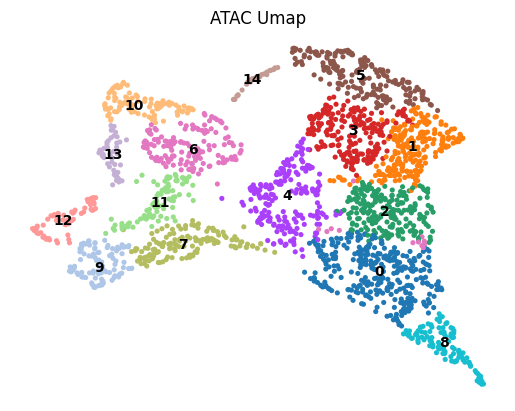
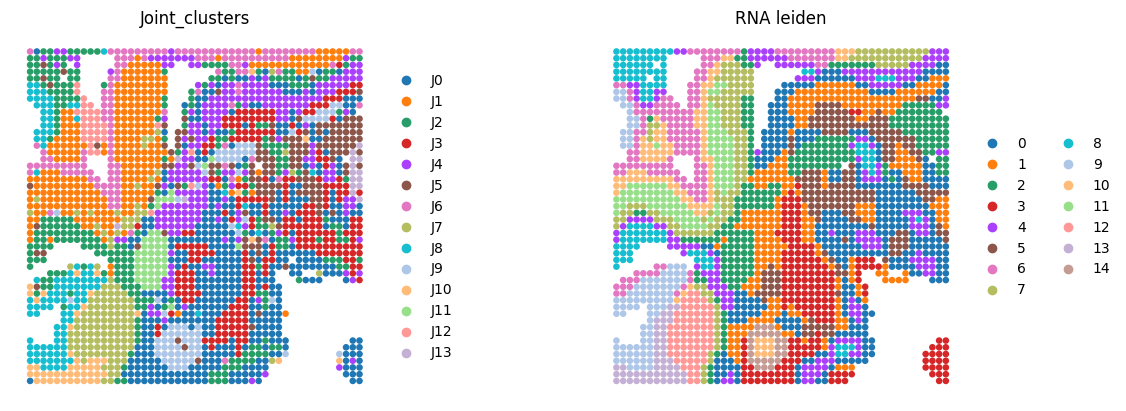
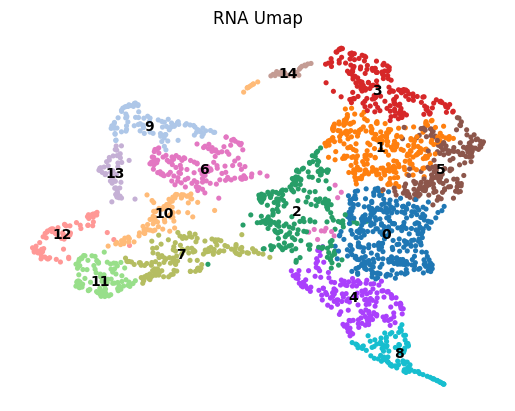
Spatial domain detection after integration
Here, we only present the spatial domains and Umap colored by Leiden.
[5]:
# evaluate and plot
# spatial domain detection
sc.pp.neighbors(adata1, n_neighbors=10, use_rep='fused_embedding')
sc.tl.leiden(adata1, resolution=0.4)
sc.pl.spatial(adata1,
              img_key=None,
              color=["Region", "leiden"],
              spot_size=0.02,
              title=['Joint_clusters', 'ATAC leiden'],
              wspace=0.1,
              frameon=False,
              save='_ATAC.png'
              )
sc.pp.neighbors(adata1, n_neighbors=10, use_rep='fused_embedding')
sc.tl.umap(adata1, min_dist=0.5, spread=1)
sc.pl.umap(adata1,
           color=["leiden"],
           wspace=0.2,
           frameon=False,
           title=['ATAC Umap'],
           legend_loc='on data',
           save='_ATAC.png')

sc.pp.neighbors(adata2, n_neighbors=10, use_rep='fused_embedding')
sc.tl.leiden(adata2, resolution=0.4)
sc.pl.spatial(adata2,
              img_key=None,
              color=["Region", "leiden"],
              spot_size=0.02,
              title=['Joint_clusters', 'RNA leiden'],
              wspace=0.1,
              frameon=False,
              save='_RNA.png'
              )
sc.pp.neighbors(adata2, n_neighbors=10, use_rep='fused_embedding')
sc.tl.umap(adata2, min_dist=0.5, spread=1)
sc.pl.umap(adata2,
           color=["leiden"],
           wspace=0.2,
           frameon=False,
           title=['RNA Umap'],
           legend_loc='on data',
           save='_RNA.png')
2025-08-25 20:47:02.787050: I tensorflow/core/platform/cpu_feature_guard.cc:193] This TensorFlow binary is optimized with oneAPI Deep Neural Network Library (oneDNN) to use the following CPU instructions in performance-critical operations:  AVX2 AVX512F AVX512_VNNI FMA
To enable them in other operations, rebuild TensorFlow with the appropriate compiler flags.
2025-08-25 20:47:03.024682: I tensorflow/core/util/port.cc:104] oneDNN custom operations are on. You may see slightly different numerical results due to floating-point round-off errors from different computation orders. To turn them off, set the environment variable `TF_ENABLE_ONEDNN_OPTS=0`.
2025-08-25 20:47:05.052557: W tensorflow/compiler/xla/stream_executor/platform/default/dso_loader.cc:64] Could not load dynamic library 'libnvinfer.so.7'; dlerror: libnvinfer.so.7: cannot open shared object file: No such file or directory; LD_LIBRARY_PATH: /home/whcai/anaconda3/envs/PyG/lib/python3.9/site-packages/cv2/../../lib64::/usr/local/cuda-12.4/lib64:/public8/lilab/student/whcai/myR/R-4.1.2/lib/
2025-08-25 20:47:05.052685: W tensorflow/compiler/xla/stream_executor/platform/default/dso_loader.cc:64] Could not load dynamic library 'libnvinfer_plugin.so.7'; dlerror: libnvinfer_plugin.so.7: cannot open shared object file: No such file or directory; LD_LIBRARY_PATH: /home/whcai/anaconda3/envs/PyG/lib/python3.9/site-packages/cv2/../../lib64::/usr/local/cuda-12.4/lib64:/public8/lilab/student/whcai/myR/R-4.1.2/lib/
2025-08-25 20:47:05.052694: W tensorflow/compiler/tf2tensorrt/utils/py_utils.cc:38] TF-TRT Warning: Cannot dlopen some TensorRT libraries. If you would like to use Nvidia GPU with TensorRT, please make sure the missing libraries mentioned above are installed properly.
WARNING: saving figure to file figures/show_ATAC.png
/home/whcai/anaconda3/envs/PyG/lib/python3.9/site-packages/scanpy/plotting/_tools/scatterplots.py:394: UserWarning: No data for colormapping provided via 'c'. Parameters 'cmap' will be ignored
  cax = scatter(
WARNING: saving figure to file figures/umap_ATAC.png
WARNING: saving figure to file figures/show_RNA.png
WARNING: saving figure to file figures/umap_RNA.png
/home/whcai/anaconda3/envs/PyG/lib/python3.9/site-packages/scanpy/plotting/_tools/scatterplots.py:394: UserWarning: No data for colormapping provided via 'c'. Parameters 'cmap' will be ignored
  cax = scatter(
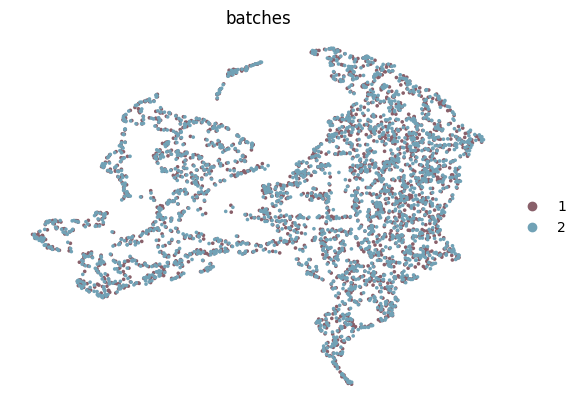
Batch effect correction
UMAP visualizations colored by modalities, illustrating that the model achieves effective integration.
[6]:
# Modality bias correction (integration)
region_color = {
    1: "#89606a",
    2: "#71a2b6",
}
adata = sc.AnnData(X=np.concatenate([adata1.obsm['fused_embedding'], adata2.obsm['fused_embedding']]))
adata.obsm['spatial'] = np.concatenate([adata1.obsm['spatial'], adata2.obsm['spatial']])
adata.obs = pd.concat([adata1.obs, adata2.obs])
adata.obs['batches'] = adata.obs['batches'].astype('category')
sc.pp.neighbors(adata, n_neighbors=15, use_rep='X')
sc.tl.umap(adata, min_dist=0.5, spread=1)
sc.pl.umap(adata,
           color=["batches"],
           wspace=0.2,
           palette=region_color,
           frameon=False,
           save='_ATAC_RNA_check_batch.png')
WARNING: saving figure to file figures/umap_ATAC_RNA_check_batch.png
/home/whcai/anaconda3/envs/PyG/lib/python3.9/site-packages/scanpy/plotting/_tools/scatterplots.py:394: UserWarning: No data for colormapping provided via 'c'. Parameters 'cmap' will be ignored
  cax = scatter(