2. osmFISH mouse somatosensory cortex datasets
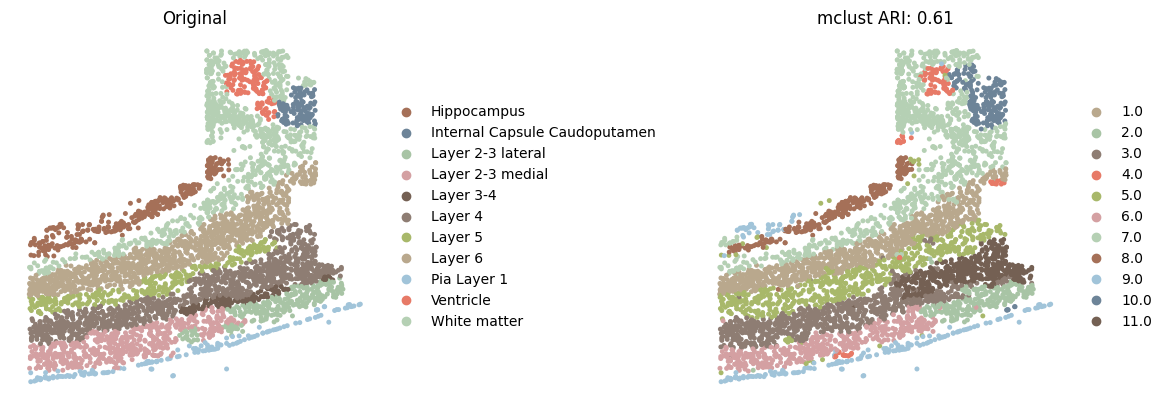
Detection of spatial domains in the osmFISH (imgae-based) mouse somatosensory cortex dataset.
The mouse somatosensory cortex dataset, generated using the osmFISH platform, includes 5,328 spots at single-cell resolution, based on the targeted detection of 33 genes. ## Preparation
[1]:
import sys
import time
from spatialFuser import *
import scanpy as sc
sys.path.append("..")
/home/whcai/anaconda3/envs/PyG/lib/python3.9/site-packages/louvain/__init__.py:54: UserWarning: pkg_resources is deprecated as an API. See https://setuptools.pypa.io/en/latest/pkg_resources.html. The pkg_resources package is slated for removal as early as 2025-11-30. Refrain from using this package or pin to Setuptools<81.
  from pkg_resources import get_distribution, DistributionNotFound
Hyper-Parameters setting
All hyperparameters are stored in the variable args. To display them during initialization, use the function call args = def_training_args(show_detail=True).
Unlike the DLPFC dataset, for low-throughput spatial transcriptomics data, SpatialFuser adopts simpler MCGATE architecture (a single layer with 32 dimensions) to learn data embeddings.
[2]:
# load args:
print("============================================")
print("=              Setting Params              =")
args = def_training_args()
args.epochs = 500
args.K = 10
args.step = 100
args.heads = 4
args.alpha = 0
args.hidden = [32]
args.lr = 8e-3
============================================
=              Setting Params              =
Load data
SpatialFuser provides a built-in data loading and preprocessing module, SpatialFuserDataLoader. The required inputs include hyperparameters, data_dir (the dataset storage directory), data_tech (either “seq-based” or “image-based”), and files (a list of h5ad files to be loaded).
For spatial omics data, SpatialFuserDataLoader constructs a KNN adjacency graph based on the specified value of K to support graph neural network training.
For seq-based data, spatially variable genes are extracted according to n_svgs to simplify the model.
All AnnData objects are normalized, log-transformed, and subsequently converted into PyG objects for model input.
[3]:
# load data:
print("============================================")
print("=               Loading Data               =")
loadtime = time.time()
dataLoader = SpatialFuserDataLoader(args,
                                    data_dir='/public8/lilab/student/whcai/Integration/data/osmFISH_mouse_cortex',
                                    data_tech='image-based',
                                    files=['osmFISH_codeluppi2018spatial_cortex_data.h5ad'])
dataLoader.load_adata()
dataLoader.remove_type(obs_name='Region', target='Excluded')
dataLoader.pre_processing(n_svgs=3000, k_cutoff=args.K, batch_label=[1])
dataLoader.generate_minibatch(loader_type='RandomNodeLoader', num_workers=5)
============================================
=               Loading Data               =
WARNING: adata.X seems to be already log-transformed.
/home/whcai/anaconda3/envs/PyG/lib/python3.9/site-packages/scanpy/preprocessing/_normalization.py:169: UserWarning: Received a view of an AnnData. Making a copy.
  view_to_actual(adata)
=         Calculating spatial graph        =
The PyG data u create is qualified
=The graph contains 53229 edges, 4839 cells=
=   11.0000 neighbors per cell on average   =
=              subgraph Info             =
============================================
=           Batch 0: 4839 nodes           =
=   10.0000 neighbors per cell on average   =
batch:[1.], node num:[4839]
============================================
Train MCGATE
[4]:
# train
print("============================================")
print("=              Begin to Train              =")
training_time = time.time()
# Train model
adata, trainer, loss_list = train_emb(args, dataLoader)
print("=            Training Finished!            =")
print("Total time elapsed: {:.4f}s".format(time.time() - training_time))
print("============================================")
============================================
=              Begin to Train              =
Epoch500 || loss: 3.7744 || MNN num: [0]: 100%|███████████████████████████████████████| 500/500 [00:20<00:00, 23.98it/s]
=            Training Finished!            =
Total time elapsed: 21.2140s
============================================
/public8/lilab/student/whcai/Integration/model/SpatialFuser/spatialFuser/train.py:392: ImplicitModificationWarning: Trying to modify attribute `._uns` of view, initializing view as actual.
  dataLoader.adata.uns['MCGATE_loss'] = loss_list
Show trainable parameters number
Because the input dimensionality for the osmFISH dataset is much lower than that of the DLPFC dataset, the corresponding MCGATE model requires far fewer parameters.
[5]:
# show param number
total_params, total_trainable_params = show_para_num(trainer.model)
param_num = {'total_params': total_params,
             'trainable_params': total_trainable_params,
             'non-trainable_params': total_params - total_trainable_params}
1,763 total parameters.
0.00M total parameters.
1,568 training parameters.
0.00M training parameters.
Evaluation and plot based on mclust
SpatialFuser provides an evaluation module, metrics, for assessing tissue domain detection tasks. It treats the Region column in anndata.obs as the ground truth and, based on the provided embed_label (an array stored in anndata.obsm), automatically computes five metrics (ARI, AMI, Homogeneity, Completeness, and V-Measure) under clustering methods including Leiden, Louvain, and Mclust.
Here, we only show the spatial domains colored by Mclust with customized colors.
[6]:
# evaluate and plot
leiden_result, louvain_result, mclust_result = metrics(adata,
                                                       save_loc='_osmFISH.png',
                                                       resolution=0.1,
                                                       spot_size=0.015,
                                                       cluster_label='Region',
                                                       plot_color=["mclust"],
                                                       mclust_model='EEE',
                                                       embed_label='embedding',
                                                       vis=False,
                                                       save=False)
print(mclust_result)

sc.tl.umap(adata)
adata.obs['mclust'] = adata.obs['mclust'].astype(str)

region_color = {
    'Pia Layer 1': "#A1C4D9",
    'Layer 2-3 medial': "#D4A0A2",
    'Layer 2-3 lateral': "#A8C4A5",
    'Layer 3-4': "#746053",
    'Layer 4': "#8E7D73",
    'Layer 5': "#A8B86A",
    'Layer 6': "#B9A88D",
    'White matter': "#B5D0B4",
    'Internal Capsule Caudoputamen': "#6D8498",
    'Hippocampus': "#A57058",
    'Ventricle': "#E77A67",
    '1.0': "#B9A88D",
    '2.0': "#A8C4A5",
    '3.0': "#8E7D73",
    '4.0': "#E77A67",
    '5.0': "#A8B86A",
    '6.0': "#D4A0A2",
    '7.0': "#B5D0B4",
    '8.0': "#A57058",
    '9.0': "#A1C4D9",
    '10.0': "#6D8498",
    '11.0': "#746053",
}

sc.pl.spatial(adata, img_key="hires", color=['Region', "mclust"],
              spot_size=0.015,
              title=['Original',
                     'mclust ARI: {:.2f}'.format(mclust_result['ARI'][0])],
              wspace=0.23,
              palette=region_color,
              frameon=False,
              save='_osmFISH.png'
              )
2025-08-25 19:44:01.344448: I tensorflow/core/platform/cpu_feature_guard.cc:193] This TensorFlow binary is optimized with oneAPI Deep Neural Network Library (oneDNN) to use the following CPU instructions in performance-critical operations:  AVX2 AVX512F AVX512_VNNI FMA
To enable them in other operations, rebuild TensorFlow with the appropriate compiler flags.
2025-08-25 19:44:01.577980: I tensorflow/core/util/port.cc:104] oneDNN custom operations are on. You may see slightly different numerical results due to floating-point round-off errors from different computation orders. To turn them off, set the environment variable `TF_ENABLE_ONEDNN_OPTS=0`.
2025-08-25 19:44:03.473932: W tensorflow/compiler/xla/stream_executor/platform/default/dso_loader.cc:64] Could not load dynamic library 'libnvinfer.so.7'; dlerror: libnvinfer.so.7: cannot open shared object file: No such file or directory; LD_LIBRARY_PATH: /home/whcai/anaconda3/envs/PyG/lib/python3.9/site-packages/cv2/../../lib64::/usr/local/cuda-12.4/lib64:/public8/lilab/student/whcai/myR/R-4.1.2/lib/
2025-08-25 19:44:03.474191: W tensorflow/compiler/xla/stream_executor/platform/default/dso_loader.cc:64] Could not load dynamic library 'libnvinfer_plugin.so.7'; dlerror: libnvinfer_plugin.so.7: cannot open shared object file: No such file or directory; LD_LIBRARY_PATH: /home/whcai/anaconda3/envs/PyG/lib/python3.9/site-packages/cv2/../../lib64::/usr/local/cuda-12.4/lib64:/public8/lilab/student/whcai/myR/R-4.1.2/lib/
2025-08-25 19:44:03.474209: W tensorflow/compiler/tf2tensorrt/utils/py_utils.cc:38] TF-TRT Warning: Cannot dlopen some TensorRT libraries. If you would like to use Nvidia GPU with TensorRT, please make sure the missing libraries mentioned above are installed properly.
R[write to console]: Package 'mclust' version 6.0.1
Type 'citation("mclust")' for citing this R package in publications.
fitting ...
  |======================================================================| 100%
             ARI       AMI Homogeneity Completeness V_Measure
mclust  0.611863  0.711322    0.730317      0.69597   0.71273
WARNING: saving figure to file figures/show_osmFISH.png